Written by Özlem Demir (by modifying & updating an older tutorial).
Why Cluster?
We cluster our trajectories to reduce the large number of frames in a typical trajectory file to a representative set of distinct frames.
Gromos Clustering Algorithm in brief
Algorithm as described in Daura et al. (Angew. Chem. Int. Ed. 1999, 38, pp 236-240):
- Count number of neighbors using cut-off
- Take structure with largest number of neighbors with all its neighbors as cluster and eliminate it from the pool of clusters.
- Repeat the same steps for the remaining structures.
Step 1: Generate Gromacs-compatible trajectory
First, create a new directory for this analysis and work in this directory.
mkdir clustering
Gromacs does not read NETCDF (.NC) files, but can read multi-frame PDB files. Thus, we start by converting our trajectory into PDB format so that Gromacs can read.
- Load the parameter file (the .prmtop file) and the coordinates file (.NC file) in VMD.
- Align the trajectory: It is typical to align the trajectory by certain atoms and then to do the clustering by another atom set. For example, one might choose to first align the trajectory by the protein alpha carbons, and then to cluster based on the positions of the residue atoms lining the active site.
In VMD, click on Extensions => Analysis => RMSD Trajectory Tool.
In the new window that popped up, the large text box initially contains the selection
protein. Change this to whatever atom selection you wish to use to align the trajectory. To align by all alpha carbons, for example, replaceproteinwithname CA. Or to align by all backbone atoms, replaceproteinwithbackbone. Now click on the “Align” button. Your trajectory has now been aligned. You can close this window. - Now right click on the trajectory name in the VMD main menu.
- Select “Save Coordinates…”
- In the “Selected Atoms” field, type
protein. - Click on the “Save…” button and save the PDB file trajectory.pdb
- Now we need to edit the trajectory.pdb file to be Gromacs-compatible. First, we need to delete the VMD-generated header. Second, we need to replace the
ENDdelimiters used by VMD to separate frames by theENDMDLdelimiters that Gromacs uses. These two things could be done by any text editor, but it will be faster to do by running command lines like below in your terminal.
To remove the VMD-generated header:
cat trajectory.pdb | grep -v CRYST1 > temp.pdb

mv -f temp.pdb trajectory.pdb
To replace END delimiters between frames by ENDMDL delimiters:
perl -pi -e 's/END/ENDMDL/g' trajectory.pdb
Now, your Gromacs-compatible trajectory file is ready.
You also will need to prepare a separate PDB file for the first frame of your trajectory.
- Open the trajectory.pdb file in VMD.
- Right click on the trajectory name in the VMD main menu.
- Select “Save Coordinates…”
- In the Frames section, set First and Last to 0, and Stride to 1.
- Click on the “Save…” button and save the PDB file first_frame.pdb
- Edit the PDB file in an editor like vi, gedit, etc to remove the VMD-generated header. (Or you can use the command lines shown above). Now, your first frame is also ready for our clustering exercise.
Step 2: Identify the Protein Residues that Line the Active Site
Typically when clustering protein trajectories for drug design purposes, you want to know about the various conformations of the protein active site. Thus, we must identify the residues that line the active site.
While there are various methods to identify active-site residues, you can start with the first frame of your trajectory (from the NETCDF file) and use VMD to identify all protein residues within 10 Angstroms of the ligand.
Example of VMD Selection:
same residue as protein within 10 of resname LIG
To get the indices of the atoms of the active-site residues, save a PDB file containing only the relevant active-site residues.
Right click on the protein name in the VMD main menu. Select “Save Coordinates…” In the “Selected Atoms” field, type something like:
same residue as protein within 10 of resname LIG
Make sure you are saving only one frame (First = 0 and Last =0 ) in this window. Click on the “Save…” button to save the PDB file. Name your file active_site.pdb. Edit the PDB file in an editor to remove all lines but the coordinate data. (Remove all HEADER lines and END line). Unfortunately, VMD re-indexes all the atoms when you save a new pdb file, so atom indices in your new file (active_site.pdb) do not match the indices in the original PDB containing the entire protein (trajectory.pdb or first_frame.pdb). Fortunately, the residue indices are not changed, so let’s just save those. From the command line, extract just the residue index numbers like this:
cat active_site.pdb | awk '{print $6}' | sort -n | uniq > resid_activesite.dat
So now you have a file containing all the residue indices of the active-site residues. Let’s pick out the lines of the original PDB file (first_frame.pdb) the have those same residue indices.
cat resid_activesite.dat | awk '{print "cat first_frame.pdb | awk STARTif ($6==" $1 ") print $0 END" }' | sed "s/START/'{/g" | sed "s/END/}'/g" | csh > active_site_correct_residues.pdb
Note that you may get the following error:
awk: {if ($6==) print $0 }
awk:          ^ syntax error
This error can be corrected if a blank line is removed from the resid_activesite.dat file.
Step 3: Identify Key Atom Indices
Now we will identify the indices of all active-site C-alpha atoms. This is because we want to cluster our trajectory based on the conformations of active site C-alpha atoms.
To get the indices of all active-site atoms:
cat active_site_correct_residues.pdb | awk '{printf $2 " "}' > active_site_atoms_indices.dat
To write the indices of the active site C-alpha atoms in the ndx format:
cat active_site_correct_residues.pdb | grep " CA " | awk '{ if ( NR%15 == 0){ {printf "%4i", $2} {printf "\n"} } else {printf "%4i ", $2} }' > active_site.ndx
and to write the indices of all C-alpha atoms of the protein in ndx format:
cat first_frame.pdb | grep " CA " | awk '{ if ( NR%15 == 0){ {printf "%4i", $2} {printf "\n"} } else {printf "%4i ", $2} }' > alpha_carbons_indices.ndx
Step 4: Create Gromacs-Compatible Atom-Selection File
Gromacs has a very specific file format (the ndx file) that it uses to read in atom selections. Here’s the general format of this file:
[ SELECTION NAME 1 ]
XXXX XXXX XXXX XXXX XXXX XXXX XXXX XXXX XXXX XXXX XXXX XXXX XXXX XXXX XXXX
XXXX XXXX XXXX XXXX XXXX XXXX XXXX XXXX XXXX XXXX XXXX XXXX XXXX XXXX XXXX
XXXX XXXX XXXX XXXX XXXX XXXX XXXX XXXX XXXX XXXX XXXX XXXX XXXX XXXX XXXX
XXXX XXXX XXXX XXXX XXXX XXXX XXXX XXXX XXXX XXXX XXXX

[ SELECTION NAME 2]
XXXX XXXX XXXX XXXX XXXX XXXX XXXX XXXX XXXX XXXX XXXX XXXX XXXX XXXX XXXX
XXXX XXXX XXXX XXXX XXXX XXXX XXXX XXXX XXXX XXXX XXXX XXXX XXXX XXXX XXXX
XXXX XXXX XXXX XXXX XXXX XXXX XXXX XXXX XXXX XXXX XXXX XXXX XXXX XXXX XXXX
XXXX XXXX XXXX XXXX XXXX XXXX XXXX XXXX XXXX XXXX XXXX
where the “XXXX” represent the indices of the atoms of that atom selection. If any index has fewer than four digits, it has to be right-justified by adding extra spaces (not tabs). We need to create a file that has two atom selections, one containing the indices of all the C-alpha carbons (contained in the file alpha_carbons_indices.ndx), and one containing the indices of all the active-site C-alpha atoms (contained in the file active_site.ndx). An example file looks like:
[ C-alpha ]
   5   30   36   53   70   87  107  124  141  157  178  190  205  224  241
 258  278  297  316  331  346  365  380  399  421  441  453  470  490  496
 510  534  550  574  595  614  638  660  677  694  706  720  734  745  764
 771  778  800  821  835  859  866  885  899  915  934  946  962  972  987

[ active_site_CA ]
 835 1465 1519 1538 1555 1565 1582 1603 1622 1638 1653 1665 1677 1696 1713
1725 1739 1750 1766 1780 1804 1871 1906 2078 2123 2130 2187 2628 2652 2668
4335 4349 4361 4397 4419 4441 4452 4463 5759 5800
Note that numbers are separated with spaces, not tabs.
Save your selection file as “selections.ndx”
cat alpha_carbons_indices.ndx active_site.ndx > selections.ndx
And edit your selections.ndx file to get the format seen in the above example file.
Step 5: How to Run Gromacs to do Gromos Clustering
First, load Gromacs module.
module load gromacs
module load cuda
With all files in the previous steps prepared correctly, you are now ready to cluster your trajectory.
gmx cluster -n selection.ndx -cutoff 0.125 -f trajectory.pdb -s first_frame.pdb -method gromos -o -g -dist -ev -sz -tr -ntr -clid -cl
For information on each of these g_cluster parameters, see http://manual.gromacs.org/archive/4.6.1/online/g_cluster.html
Two output files are always written: -o writes the RMSD values in the upper left half of the matrix and a graphical depiction of the clusters in the lower right half.
Additionally, a number of optional output files can be written: -dist writes the RMSD distribution. -ev writes the eigenvectors of the RMSD matrix diagonalization. -sz writes the cluster sizes. -tr writes a matrix of the number transitions between cluster pairs. -ntr writes the total number of transitions to or from each cluster. -clid writes the cluster number as a function of time. -cl writes average (with option -av) or central structure of each cluster or writes numbered files with cluster members for a selected set of clusters (with option -wcl, depends on -nst and -rmsmin).
After running the above from the command line, you’ll get a lot of text output ending in:
Select group for least squares fit and RMSD calculation:
Group     0 (     C-alpha) has   367 elements
Group     1 (active_site_CA) has    85 elements
Select a group:
The labeling text is misleading, apparently. You need to first select the atom group by which you wish to cluster. Type “1” and press enter. You’re interested in the active site conformations for drug design purposes. (Note that the trajectory has already been aligned previously in VMD.)
The following additional text appears:
Select group for output:
Group     0 (     C-alpha) has   367 elements
Group     1 (active_site_CA) has    85 elements
Select a group:
Again, type “1” and press enter. Output will only be written for the active site alpha carbons. (You’ll be obtaining all-atom information another way, as described below.)
Gromacs now runs and generates an output file called cluster.log. Here’s what the first couple of lines of that file looks like:
Using gromos method for clustering
Using RMSD cutoff 0.14 nm
The RMSD ranges from 0.0637001 to 0.388457 nm
Average RMSD is 0.20783
Number of structures for matrix 1601
Energy of the matrix is 126.831 nm

Found 23 clusters

Writing middle structure for each cluster to clusters.pdb
Counted 268 transitions in total, max 30 between two specific clusters

cl. | #st rmsd | middle rmsd | cluster members
  1 | 805 .141 |   1356 .120 |    640    641    644    645    649    650    651
    |          |             |    661    662    663    664    665    667    669
    |          |             |    670    671    677    682    683    684    691
  2 | 186 .141 |    184 .120 |     93     95     99    101    102    106    111
    |          |             |    116    117    118    119    120    121    123
  3 | 180 .141 |    459 .124 |    408    409    411    414    415    416    417
  4 |  84 .133 |    376 .117 |    293    294    301    304    305    312
  5 |  78 .134 |     50 .115 |     21     22     23     24     25
cluster.log file shows the detailed results of the clustering. For example, notice that cluster 1 (the most-populated cluster) has 805 members (not all shown). The central member of the cluster (i.e. the most representative frame or the cluster centroid) is the 1356 frame of the trajectory. Note that, Gromacs starts numbering the frames with -1 while VMD starts numbering frames with 0. So if you want to extract cluster representative frames from your trajectory file, you must convert the Gromacs frame index to a VMD frame index by just adding 1.
cluster.log is not the only file that is generated as output. There is a pdb file called clusters.pdb that contains the pdb files of all the cluster centroids. Also make sure to check out the several .xvg files generated as output files. You can open them and see the plots by typing:
xmgrace FILE.xvg &
If you dont have xmgrace and want to plot .xvg files with gnuplot instead, remember to use
set datafile commentschars "#@&"
to avoid gnuplot trying to interpret Grace-specific commands in the .xvg file or use the -xvg none option when running the analysis program. For simple usage,
plot "FILE.xvg" using 1:2 with lines
is a hack that will achieve the right result.
Step 6: How to Identify the Best Cutoff
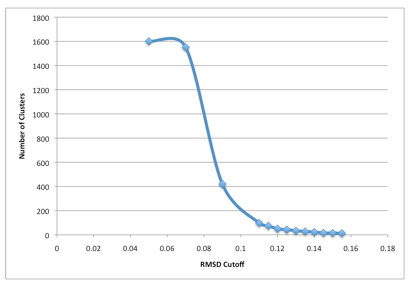
Notice above that the command line parameter “cutoff” was set to 0.125 (in nanometers as Gromacs uses nanometers, not angstroms). This is not necessarily the best RMSD cutoff for the clustering. In reality, various cutoff parameters must be tried to find an optimal cutoff. A good way is to run clustering with multiple cutoff values and make a plot of Number of clusters versus RMSD cutoff.
A RMSD cutoff should be chosen to satisfy the below conditions:
- The total number of clusters is reasonable (perhaps 40 or fewer),
- 90% of the trajectory is contained in even fewer clusters (less than 7ish),
- There are not many clusters that contain only 1 member.
In the example of the picture above, a cutoff of 0.14 was ultimately chosen.
Number of clusters (at the same RMSD cutoff for all your proteins) versus IC50.