Written by Bryn Taylor and Terra Sztain-Pedone
Motivation
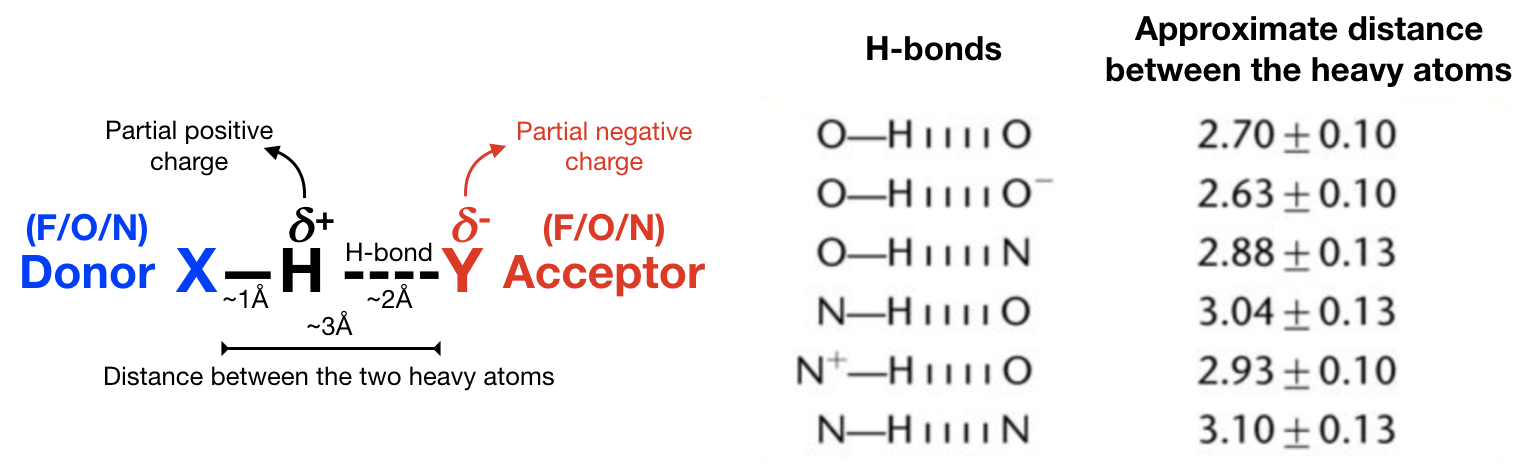
Hydrogen bond analysis identifies the number and/or duration of hydrogen bonds in a system of interest. A hydrogen bond is formed when a single hydrogen (H) is shared between the heavy atom it is covalently bonded to (the “donor”) and another heavy atom (the “acceptor”) (see Figure 1). This hydgrogen bond (which is really a “weak interaction”) is usually with electronegative atoms such as fluorine (F), oxygen (O), or nitrogen (N). Remember, H-bonding is FON!
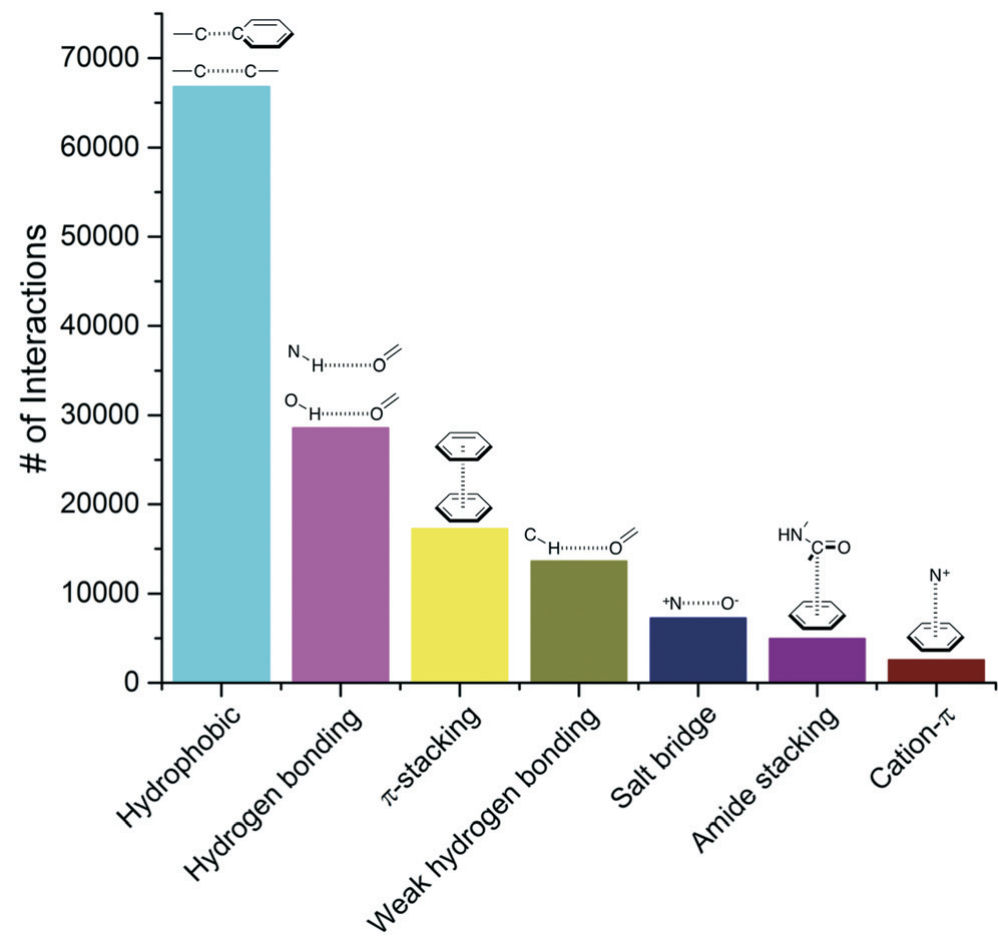
Hydrogen bonds facilitate molecular interactions and are ubiquitous in nature. The bond between a H on a water molecule and an O on another water molecule is resposible for the cohesive property of water. H-bonds also play a big role in the interaction of ligands and proteins (see Figure 2), which is what we’ll be covering in this tutorial. Make sure to answer all the questions and do this tutorial for each HSP90 system.
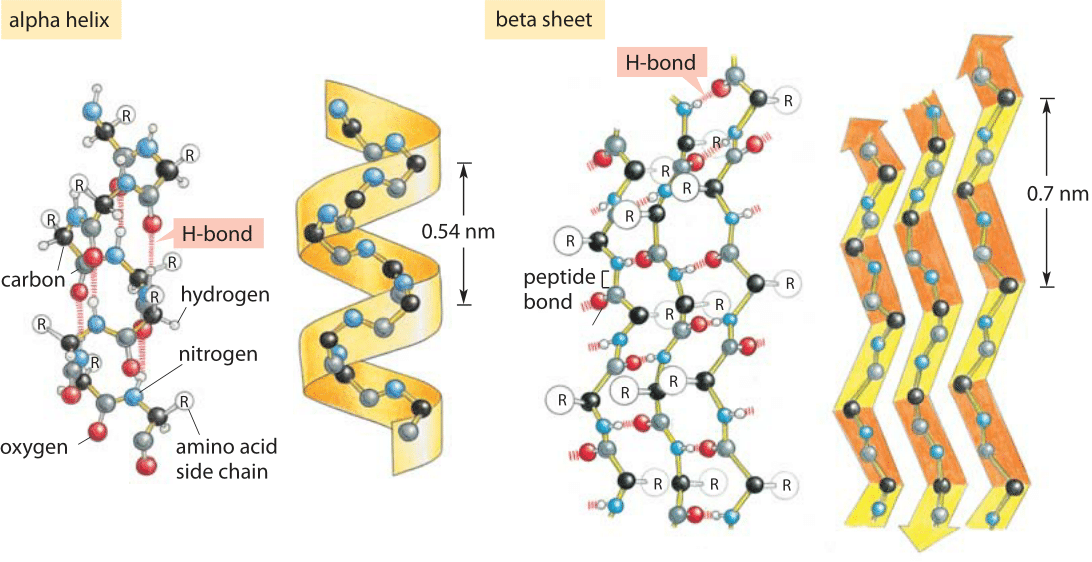
H-bonds are also important for the secondary structure of proteins: depending on the spacing of the amino acids, H-bonds formed between these residues create alpha helices or beta sheets.
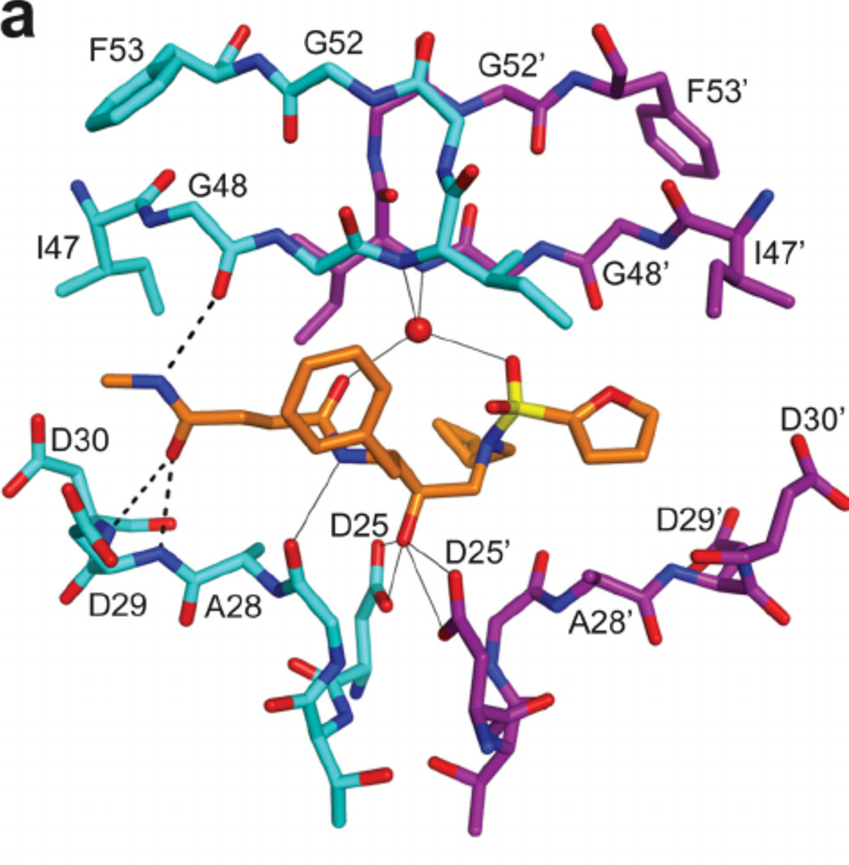
A large portion of molecular dynamics simulations of protein-ligand complexes is for the purpose of drug discovery. Whether a drug binds to the active site or an allosteric site of an enzyme, some molecular forces are driving the binding. Hydrogen bonding is often critical to stabilizing these protein-ligand complexes. Below is an example of an HIV protease inhibitor binding to the active site of an HIV protease.
Q1: What role do you think H-bonds play in the interaction between a ligand and a protein?
Step 1: Visual inspection of H-bonds in protein-ligand system.
First, create a new directory for this analysis.
> mkdir hbond_analysis
Next, examine the trajectory files in VMD. In the Distance Analysis tutorial (https://ctlee.github.io/BioChemCoRe-2018/distance-analysis/), you identified some important bonds or interactions between the ligand and protein in the first frame and in the last frame. Some of these may have been H-bonds. Let’s do this again, but pay attention to only the H-bonds. Recall that you need to first load and align the trajectories, and create new graphical representations for the protein, ligand, and waters.
Q2. In your notebook, list ligand-protein or ligand-water hydrogen bonds that are in the first or last frame. For example:
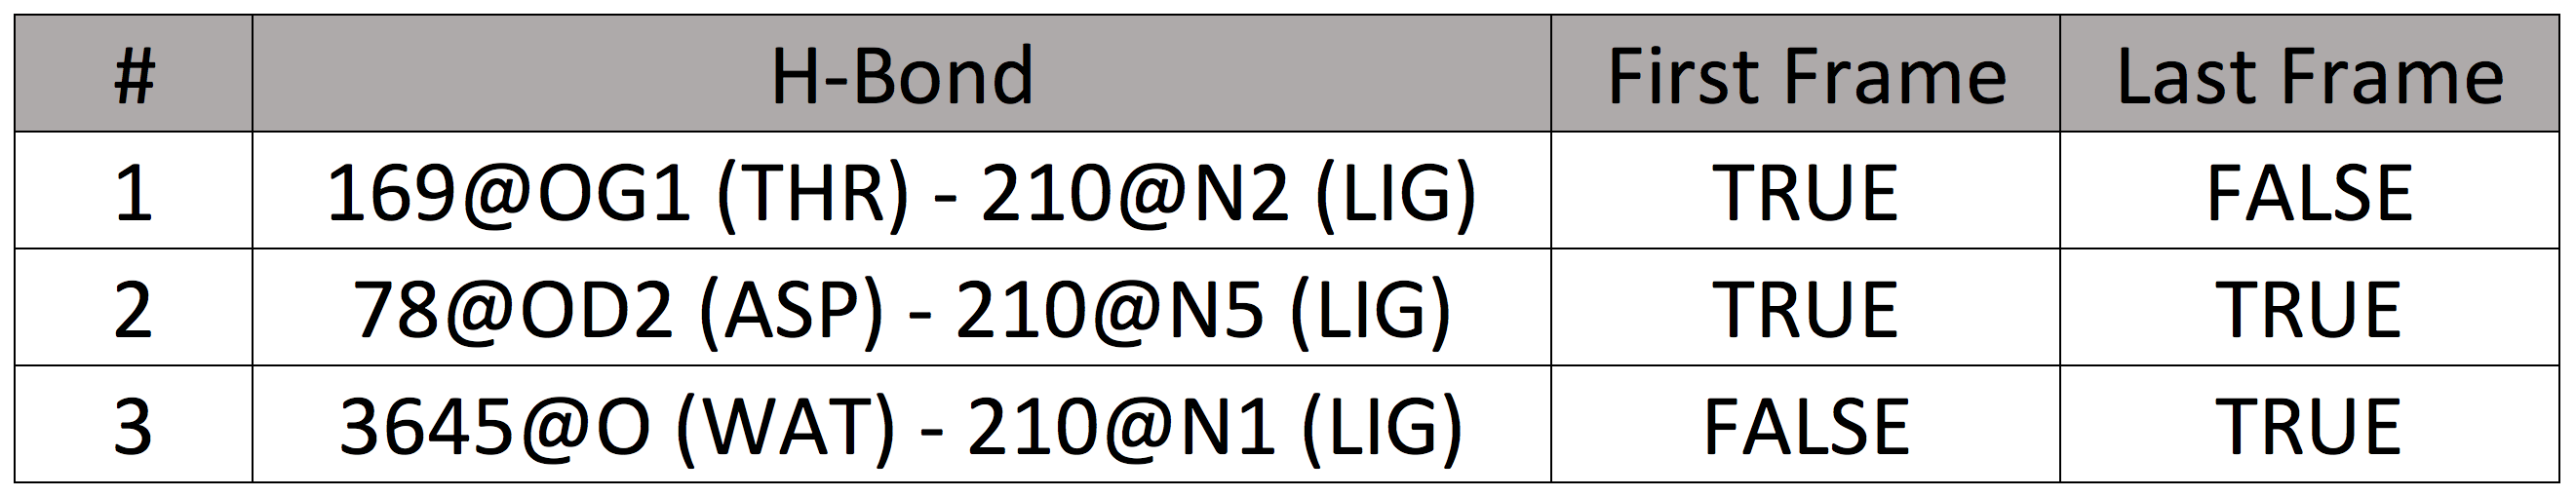
Repeat this for each trajectory (md1, md2, md3) of the three replicates for each HSP90 system. You may have already done some of this work; save time by repurposing and/or adding to it!
Q3. For each system and replicate, make a clear and informative figure that shows the hydrogen bonds you identified in Q2. Don’t forget labels!
Q4. Do the number of H-bonds differ much between md1, md2, md3 replicates? What about between HSP90 systems?
Step 2: Finding and plotting all protein-ligand H-bonds
Now that you’re familiar with the types and number of H-bonds at the beginning and end of the simulations, we’re going to take a look at the number of H-bonds over time. Counting these on a frame-by-frame basis in VMD would take forever, so we’re going to write a script that will do it for us.
1. Launch a jupyter notebook.
> cd hbond_analysis

> jupyter notebook
Create a new notebook by clicking new python 3 notebook in the upper right corner of the page. Name this notebook “hbond_analysis.ipynb”. The next steps will be done in your notebook.
2. Load Modules
import mdtraj as md
import pytraj as pt
import numpy as np
import matplotlib.pyplot as plt
% matplotlib inline # this makes your plot print in the jupyter notebook
3. Load Trajectories
traj = md.load('/scratch/bcc2018_trajectories/${BCCID}/md1/${BCCID}-Pro01.nc',
              top = '/scratch/bcc2018_trajectories/${BCCID}/${BCCID}.prmtop',
              stride = 1)
print(traj)
4. Define a function for labeling hydrogen bonds
The mdtraj hbond function, which we’ll use today, returns atom numbers. Let’s make it easier for us to interpret by defining hbond_label. The output is three coulums of the format: hbond donor, proton, hbond acceptor.
def label(hbond):
    hbond_label = '%s -%s- %s' % (traj.topology.atom(hbond[0]), traj.topology.atom(hbond[1]), traj.topology.atom(hbond[2]))
    return hbond_label
5. Specify the ligand and protein
ligand = traj.topology.select('resname LIG')
protein = traj.topology.select("protein")
6. Find all ligand-protein hydrogen bonds
# figure out how many frames you loaded, this is how many frames we will look for hbonds in
n_frames = len(traj)
print(n_frames)
# This set will give us all of the unique hbonds that are made with the ligand, without repeats
# We will want to have this later so we make it not to avoid repeating hbond calculation
all_hbonds_set = set()
# This list will store all of the hbonds made per frame
hbonds_each_frame = []
# We want to create a dictionary containing every frame and the ligand hbonds which occur in that frame
Frame2hbond = {}
for frame in range(n_frames):
    # The dictionary "words" are the frame number
    Frame2hbond[frame] = []
    # We are doing the hbond analysis frame by frame
    hbonds = md.baker_hubbard(traj[frame])
    hbonds_each_frame.append(hbonds)
    # We only care about the hbonds if they involve the ligand
    for hbond in hbonds:
        if ((hbond[0] in ligand) and (hbond[2] in protein) or #This is when the ligand is donating
            (hbond[2] in ligand) and (hbond[0] in protein)): #This is when the ligand is accepting
            all_hbonds_set.add(tuple(hbond))
            # The dictionary "definitions" are all the hbonds in that frame
            Frame2hbond[frame].append(tuple(hbond))
Q5. How would you re-write this code to easily figure out all the frames which your favorite hbond is made in?
(Hint you probably want the dictionary to have hbonds as the “words” and frames as the “definitions”) This could be useful if you want to calculate a closest to average structure in order to show a representative figure of a hbond that is important for positioning your drug into an enzyme active site.
7. Plot the total number of hydrogen bonds per frame
x = [] # these are all the frames
y = [] # this is the total number of hbonds in that frame
for frame in Frame2hbond:
    x.append(frame)
    y.append((len(Frame2hbond[frame])))

## Make your own pretty plot based on the matplotlib skills you've learned.
## Change the size, resolution, color, and make sure to label axes and give the plot a title!
plt.plot(x,y)
plt.savefig('figure_name.png')
plt.show()
Q6. Plot the total number of H-bonds per frame for each replicate (md1, md2, md3) for each HSP90 system.
That’s 18 plots! You probably want to write a for loop so you don’t have to do this 18 times! Find a way to put this information all together in one image or plot – make it as clear and readable as possible.
Q7. Now let’s compare the systems and try to correlate the H-bond information with IC50 values.
You were given the IC50 values (in nM) for each ligand. As you have done for the previous analyses, we will express IC50 as pIC50 (pIC50 = -log(IC50)). Think back to the Distance Analysis tutorial, where you plotted the standard deviation of the most stable conserved distance for each system against the pIC50. How would do the same thing in terms of H-bonds? Brainstorm a few ideas and find a way to turn this into an informative figure. Remember to account for the three replicates for each system.
Q8. Which H-bonds persist throughout the entire simulation?
Use your knowledge from the water residency tutorial and combine it with what you’ve learned today to figure out which H-bonds remain constant over time.
Q9. Summary figure.
Prepare a slide with the most important results you have from this tutorial. Make sure to include an informative VMD figure and a plot correlating H-bonds and IC50s. Be ready to clearly explain what you found to someone who doesn’t know anything about what you’re doing!